

measured weekly · git metadata only · unranked · atom feed
Survival Report
Every week, one numbered report: for each measured open-source repository, how many lines were introduced by commits that carry machine-readable AI authorship metadata, and how many of those lines git blame still attributes to them at HEAD. AI-tagged means that metadata matched; it does not prove a model wrote the line. These are counts, not grades. No rank, no colour, no verdict; rows are alphabetical; intervals describe the sampled repositories only. Every number is reproducible with one command, the method and its limits are public, and the README says what the audit, the local ledger and a Seal each do.
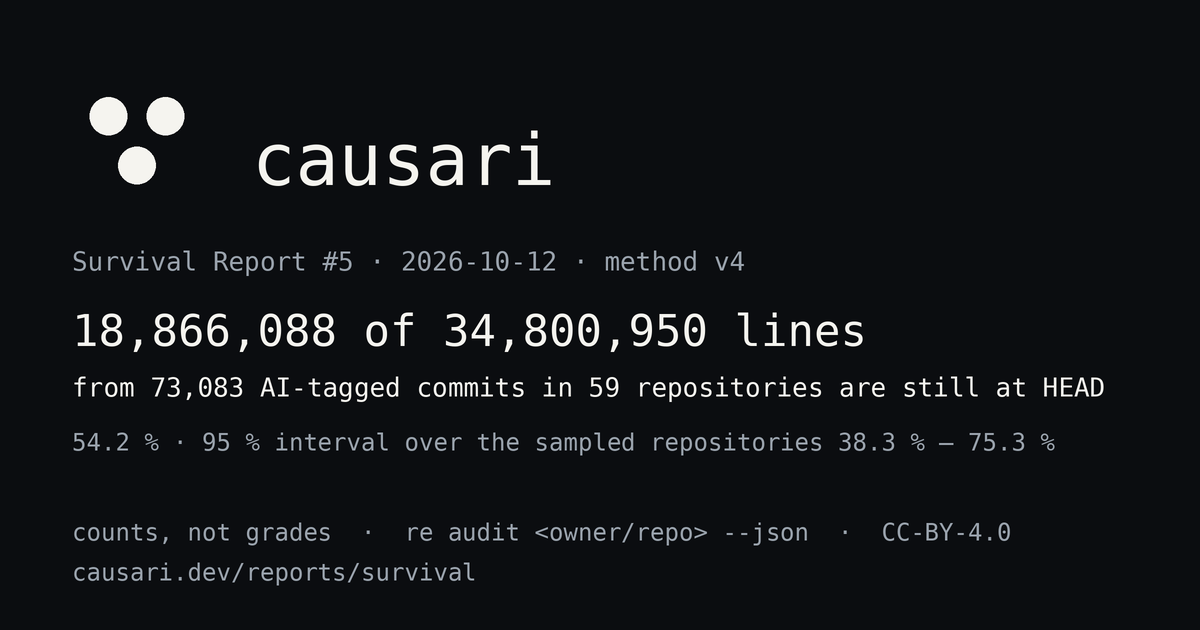
Latest: Survival Report #5 · 2026-10-12 — 18,866,088 of 34,800,950 lines introduced by 73,083 AI-tagged commits in 59 open-source repositories are still at HEAD (54.2 %). 95 % interval over the sampled repositories: 38.3 % to 75.3 %.
All reports
| Report | Date | Repositories | AI-tagged commits | Lines introduced | Still at HEAD | Line-weighted | Method | DOI |
|---|---|---|---|---|---|---|---|---|
| Survival Report #5 | 2026-10-12 | 59 | 73,083 | 34,800,950 | 18,866,088 | 54.2 % | v4 | 10.5281/zenodo.23323312 |
| Survival Report #4 | 2026-10-05 | 59 | 68,274 | 32,730,982 | 17,512,878 | 53.5 % | v3 | 10.5281/zenodo.23196011 |
| Survival Report #3 | 2026-09-28 | 43 | 39,706 | 21,286,167 | 13,068,031 | 61.4 % | v3 | 10.5281/zenodo.23019874 |
| Survival Report #2 rev. 2 | 2026-09-23 | 54 | 58,061 | 27,108,452 | 13,733,809 | 50.7 % | v2 | 10.5281/zenodo.22944117 |
| Survival Report #1 | 2026-09-20 | 10 | 12,349 | 754,476 | 462,838 | 61.3 % | v2 | 10.5281/zenodo.22863966 |
The line-weighted column is not a series. Each rate is lines still at HEAD divided by lines introduced, inside that report's own aggregated repositories. #5 aggregated 59 repositories under method v4; #4 aggregated 59 repositories under method v3; #3 aggregated 43 repositories under method v3; #2 aggregated 54 repositories under method v2; #1 aggregated 10 repositories under method v2. A different repository count and a different method mean the rates do not measure the same thing over time. A repository followed across reports is on its page.
The report replaced the weekly measurements table in September 2026. Repositories enter .github/survival-repos.txt by pull request or through the weekly discovery, which lists the most-starred public repositories where GitHub commit search finds at least five commits carrying AI authorship metadata (how repositories are selected). The date in the list is the last discovery run that finished; a run that does not finish leaves the list as it was. Maintainers opt out with one line in .github/survival-optout.txt.
Every repository has a page and a badge: its counts across reports, the exact bytes behind each number, and a README badge that follows the latest report.
What this report is, and is not
This report counts lines. For each repository it states how many lines were introduced by commits that carry machine-readable AI authorship metadata (trailers such as Co-Authored-By naming an agent, bot author identities, aider markers, and, from method v4, git-ai notes that name a non-empty tool; method v3 counted any git-ai note), and how many of those lines git blame still attributes to those commits at HEAD, under the method version stated on the page (blame with -w -M -C, a per-commit weight cap, a sample floor, full clones only; from method v3 the untagged lines of the same repository, in the matched age windows, stand next to the AI-tagged ones). Every row is reproducible with one command.
It is not a quality judgement, a productivity measure, total AI usage, proof of authorship, a security finding, a correctness finding, or a causal effect of AI. Deleted lines include removed features and rewritten prototypes; surviving lines include dead code. It is not a sample of all AI-assisted code: inline completions leave no trace in git, untagged agent commits are invisible, and the repositories were selected, not drawn at random: a hand-picked list and the public repositories in which GitHub commit search finds at least five commits carrying the same AI authorship metadata, most-starred first; each report states its own selection. The intervals describe the sampled repositories only.
Prior measurement work asks related questions with different instruments. GitClear publishes churn reports built from code-change patterns across the repositories it analyses; arXiv 2601.16809 ("Will It Survive?") follows the modification of agent-authored code in 201 projects with its own detector and finds that such code is modified less often than human-written code. This report does not reproduce either method and does not adjudicate between them: it publishes counts from git metadata alone, with the method version, the tool version and the exact bytes behind every number, so that the three can be read side by side.
re audit <owner/repo> --json # the exact bytes behind any row